Power BI
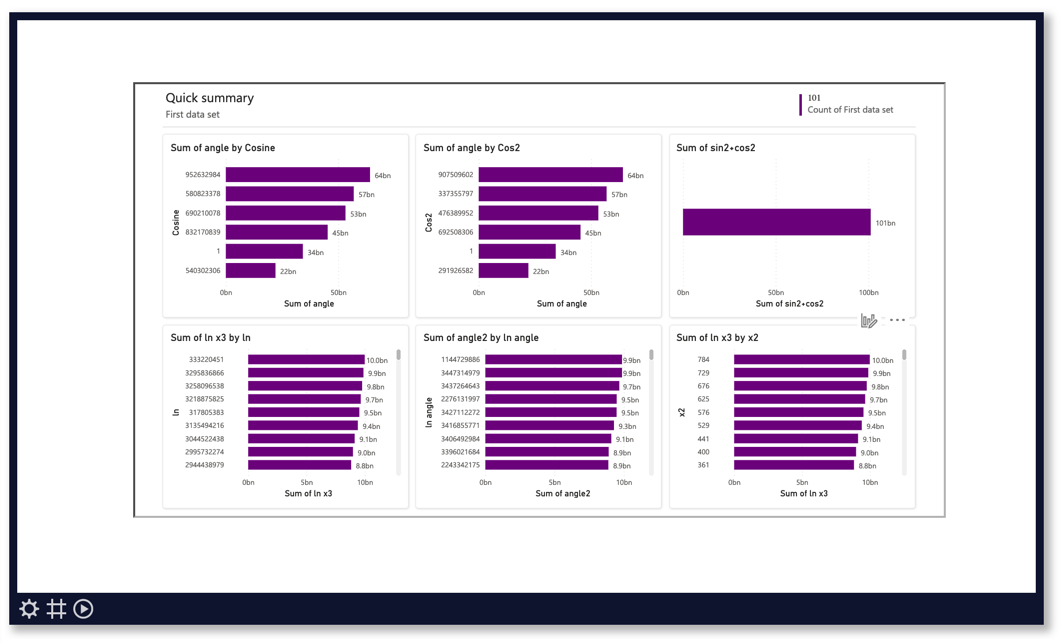
The Power BI app enables you to display your Power BI reports or dashboards in a secure way. First you connect your your Power BI account and then you select what report or dashboard you like to display.
Properties
You can configure the app using the following properties:
| Property | Explanation |
|---|---|
| Power BI account | Select the Power BI account you like to access your data with. Note that unlike most apps that you connect an account with, the Power BI does not tell us what Power BI user account is used to log in. That means that if you connect your account again, it will create a new entry in this select box, instead of updating an existing entry. It is therefore recommended that you remove any old entries that you are looking to replace on the authorized accounts page. |
| Workspace | Select a specific workspace you like to look for a dashboard or data. |
| Document type | Select if you like to display a dashboard or a report. |
| Dashboard | Select the dashboard you like to display. |
| Report | Select report you like to display. |
| Page | Select a report page you like to display. Leave this empty to show the default page. |
| Bookmark | If your report contains any report-level bookmarks, you can select one here to display the corresponding report view. |
| Filters | This button will open the filters popup in which you can add filters that will apply to the data shown in the PowerBI app. For more information about how to use these filters see the paragraph below. |
 |
This button will show or hide all applied filters in the PowerBI app. Please note: this button will not switch the filters on/off. This option only applies to the Designer; even if this options is activated in the Designer the filters will never show on your TV screens. |
And finally there are a number of generic app properties that you can configure that you'll find on many other elements as well.
Filters
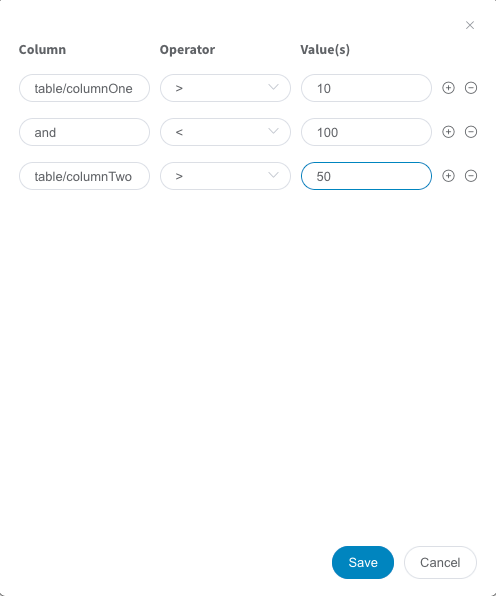 In the Filters popup you can define one or several filters that will be applied to the data in the PowerBI app on top of the filters that are already defined in the report/dashboard. Use the Show/hide filters button to see a list of the filters that are applied to the data.
- A simple filter can be defined in one line; put the table and column name in the first field, the operator in the middle field and the value in the third field.
- A filter that contains two operators can be defined in two lines (use the + button to add a second line); put the table and column name in the first field, the operator in the middle field and the value in the third field, on the next line put the logical operator (And or Or) in the first field, the second operator in the middle field and the second value in the third field.
An example of these two types of filters can be seen in the image above.
Please note:
- None of the table names, column names and types of these columns is available for the app to check. The data you enter is submitted to the Microsoft servers as is and will only result in a correctly working filter if you enter the names and types correctly.
- The operators that are available are: <, <=, =, !=, =>, >, Contains, Does not contain, Starts with, Does not start with, Is blank, Is not blank, In, Not in, All.
- Column names need to be preceded by the table name with a slash (/) in between.
- Use the - button at the end of a line to remove that line.
- The filter settings will only be saved if you save the page in the Designer.